
Topic 2: How to check normality of data?
Normality checking (How to check the normality?)
The three important methods of checking the normality of data are,
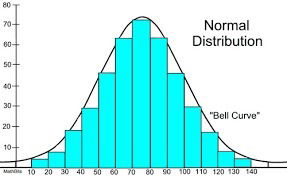
Histogram method: Plot a histogram for the data and check whether the curve is symmetrical. If the curve is symmetrical, data/variable follows normality.
Shapiro-Wilk test: The null-hypothesis of this test is that the population is normally distributed. So if p value is greater than 0.05, data follows normality. Usually applied when sample size is small.
Kolmogorov Smirnov test (K S test): The null-hypothesis of K S test is that the population is normally distributed. So if p value is greater than 0.05, data follows normality. Usually applied when the sample size is large.
Theoretical Properties of a normal distribution/normal curve are
- Normal curve is bell-shaped
- Normal curve is symmetric about the mean
- The mean is at the middle and divides the area into halves
- The mean, median, and mode are equal
- The total area under the curve is equal to one
- The normal curve approaches, but never touches, the x-axis and extends up to positive and negative infinity
- Unimodel in nature (only one mode)
- Skewness=0
- Kurtosis=3 (mesokurtic)
- For a normal curve [Fig ],
- 68.27% of the observations lie between mean ± 1SD
- 95.45% of the observations lie between mean ± 2SD
- 99.73% of the observations lie between mean ± 3SD

- ....................................................................................................................................
Reference: "Handbook on Biostatistics for Health Professionals, Karun M K and Amitha P, (2019), BCC publications"
....................................................................................................................................